Team Dashboards.
The three built-in dashboards show the threat landscape the way Liberty91 sees it. Team Dashboards let you add your own views: dashboards built from your team's saved searches, showing the live, most recent events for each one. Create as many as you need; every dashboard is shared with the whole team and listed by name under Team Dashboards in the sidebar.
What a dashboard is
A Team Dashboard is a grid of up to six tiles on a three-column by two-row layout. Each tile is backed by one saved search and shows the most recent events matching it, updating live. The grid fills the screen, tiles scroll internally when there are more events than fit, and clicking a row in any tile takes you straight to that event.
Create a dashboard
- Go to Team Dashboards in the sidebar and create a new dashboard.
- Name it and pick the first saved search to power its first tile.
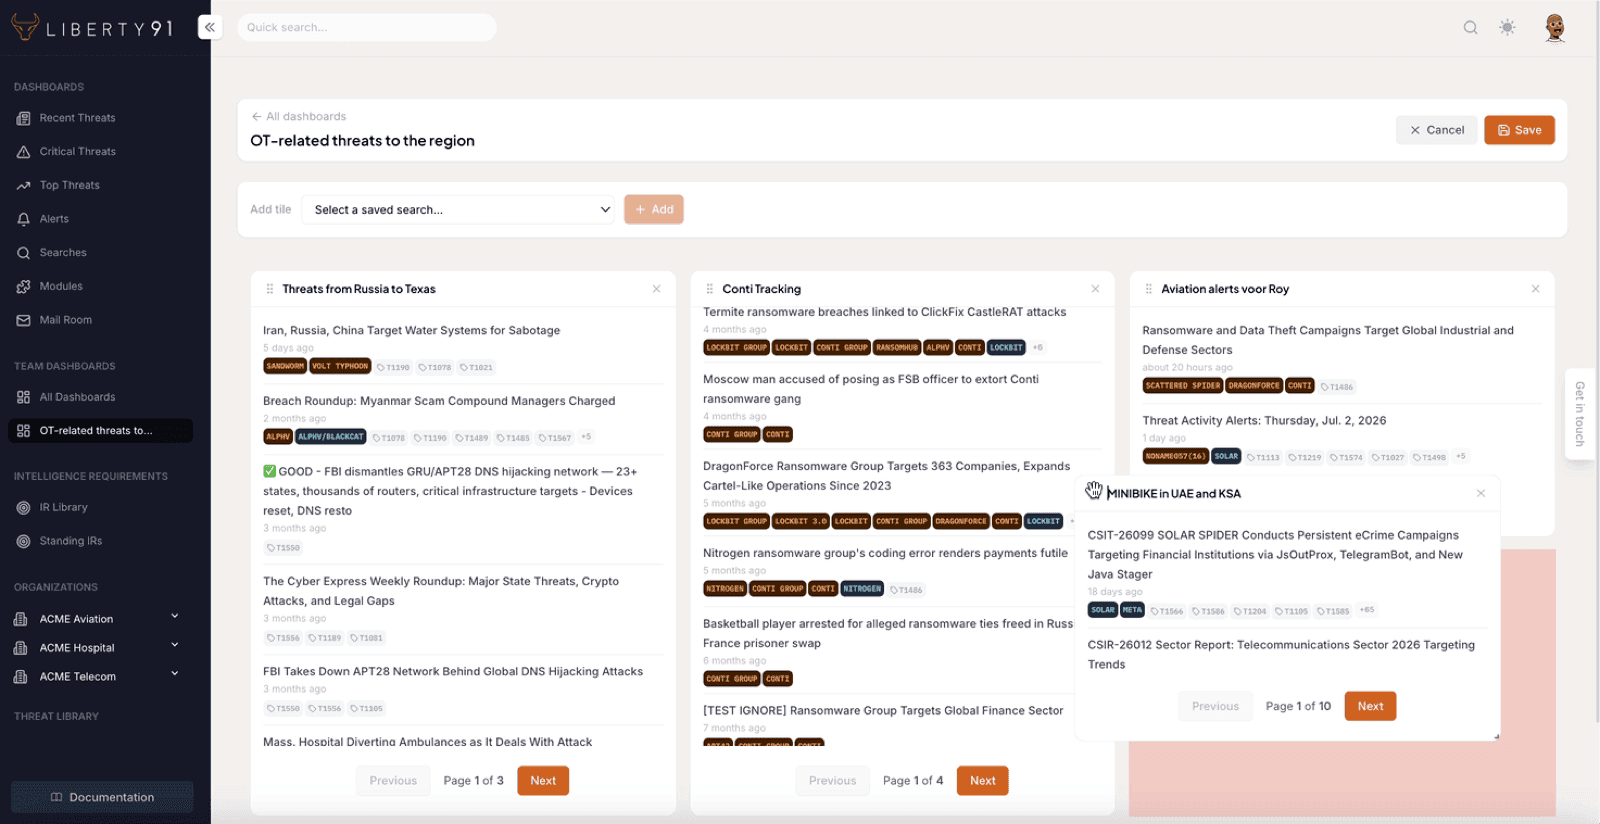
- Click Edit to add more tiles, drag them to rearrange, and resize them on the grid.
- Click Save. The layout is stored for everyone on the team.
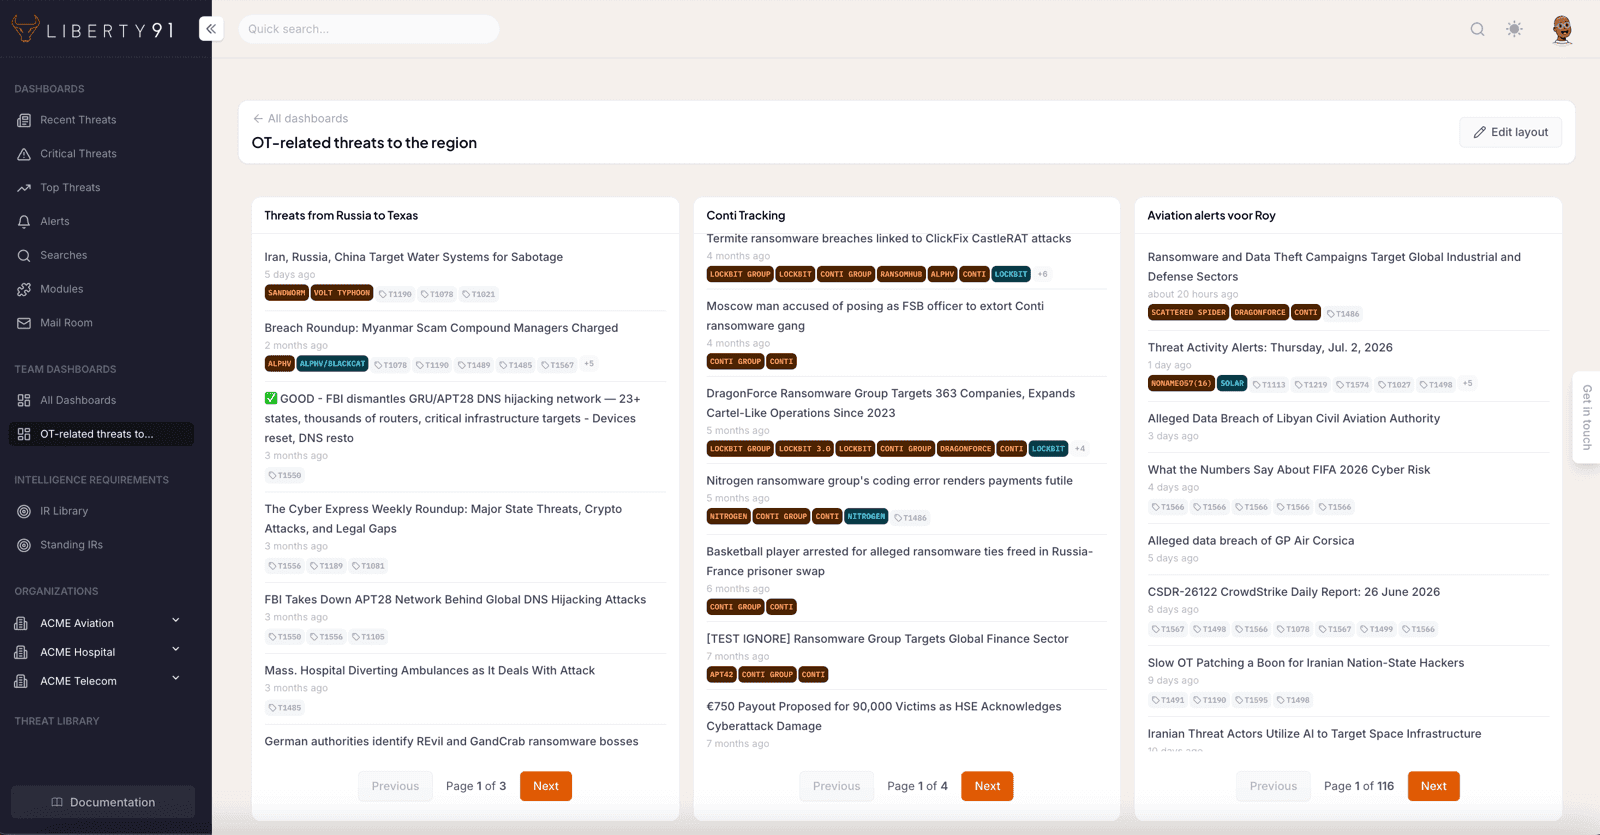
Because tiles are powered by saved searches, a dashboard stays current by itself. Refine the underlying search and every tile using it follows; there is nothing separate to maintain on the dashboard. A team typically keeps one dashboard per watch area, for example one for customer-facing sectors and one for the Intelligence Requirements currently in focus.